
The third project at Metis is one on classification called Project McNulty.
We’re all on our own now! Find your own data and come up with your own project. I wanted to use climate and weather data for this project and one article led to another before I found myself reading about how local climate changes can cause local extinctions or migrations of animals. I thought it would be interesting to see if I could build a binary classifier model using environmental factors to predict whether or not a species had changed in its IUCN endangerment status (see last post for an explanation of what that is). It would also be cool if the model could predict whether or not the species had changed for the better or worse.
I combined data from the following four sources:
… to retrieve the following features for my model:
As mentioned in the previous post, the majority (94%) of species that I analyze actually had no change in IUCN status. As a result, I will focus on reporting precision (out of the species my model predicted to have changed, what percentage actually did change) and recall (out of all the species that did change, what percentage was my model able to catch) scores as opposed to accuracy scores. This is because, if I had a very naive model that just predicted that every species didn’t change, it would still be 94% accurate, which is a highly misleading statistic.
Gradient boosting ended up having the best performance for all three scenarios (any change, worse change, or better change). I used a stratified test/train split (i.e. maintain the same proportion of those that did change to those that didn’t in the test and train datasets) of 30/70 to try to help with the very skewed distribution of data.
The precision recall curve for my model to predict any change in IUCN status is show below: 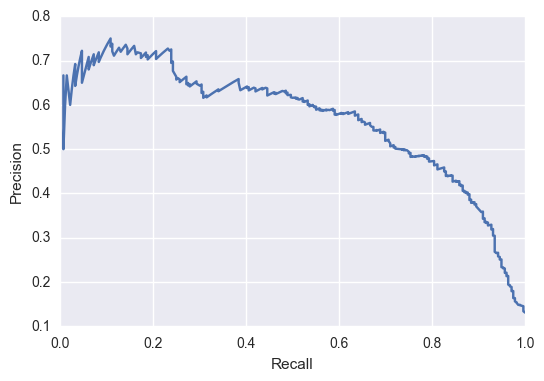 The average precision (across all thresholds) is about 55%. Depending on what you are trying to achieve, you can choose which threshold would be optimal. It’s always a trade-off between precision and recall because with high precision, your model is only predicting the very obvious cases and will let a lot of cases slide though, leading to very low recall. Alternatively, with high recall your model is being too sensitive and predicting every species to have changed (which will catch them all but have a low correctness, thus low precision).
The precision recall curve for my model to predict a change for the better (improving in IUCN status) is below: 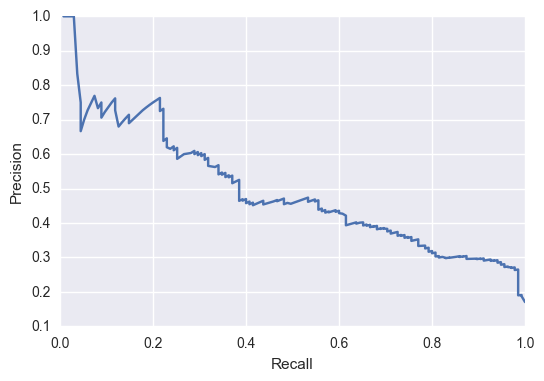 Now, for the species that improved in their status, we are probably interested in picking a threshold that has a low recall but a high precision. This is because, we’re not interesting in identifying all species that have improved, but it might be good to find a few key examples to see what’s improved in their situation to help other programs. Thus, it’s important to be able to trust your model when it says a species had had a positive change (implying high precision).
However, for the model to predict a worse change (becoming more endangered): 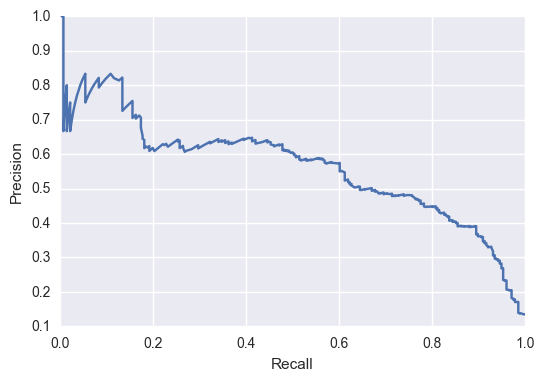 We would be interested in picking a threshold with a high recall but low precision. With species that are becoming more endangered, we want to be able to identify all of them, even if it means we have to sort through some extra cases. So, it’s okay if our model shoots off a lot of false positive, as long as in the end we can catch them all!
This project has been one my favorites so far at Metis. I was able to learn a lot about other metrics for analyzing results and plus I got to do a cool d3 visual with it (check the last post!). I hope to revisit this problem in the future and try making models with upsampling as another way to deal with the skewed nature of the data to help performance. Definitely a battle I plan to fight after the boot camp ends.